photo credits: Photo by Joe Woods on Unsplash
Visualization of the European Go Championship’s Finals

Motivation
Just a few days ago the world chess championship ended. Of course, it is a very important event that always appears in the media. FivethirtyEigth is no exception. I am not a big fan of chess (I practiced it in my high school days, but I never spent enough time to be competent at it), but like any other sporting event, I find it fascinating to keep up to date with what is going on. The FTE coverage was very interesting and in particular I found the viewing of the games very engaging. In it, they visualized the stockfish AI’s evaluation of the game.
Just at that time, something that was happening that perhaps did not receive so much publicity, was the European Go championship. It’s been a couple of years now (covid world phase) that I don’t play Go actively, but it is still a game that I love. And precisely for this reason I thought of repeating the visualization of the good people of FTE but in the Go championship. A little to practice visualization (I considered it an interesting challenge) and another because offering that analysis could make someone understand the games a little better.
Analyzing Games
To analyze the games I used KataGo an AI with some interesting extras. As of January 2021, KataGo is one of the strongest open source Go bots available online. KataGo was trained using an AlphaZero-like process with many enhancements and improvements, and is capable of reaching top levels rapidly and entirely from scratch with no outside data, improving only via self-play. Normally I used katago as a powerful AI to play against the machine. However, it can also be used to analyze games, and it is something that is being incorporated in the websites specialized in playing Go online. It is interesting to note that it is very likely that for the average player the variations offered by KataGo are not entirely recommendable, since a good review requires understanding what is being done (the direction and sense of play). Even so, the KataGo analysis allows to evaluate both the probability of victory and the difference in the estimated score of both players.
To launch this analysis, you can use the raw version of Katago directly from the terminal. But as I had in mind to analyze several games, I found this repo: analyze-sfg
analyze-sfg allows you to launch the katago analysis mode for several games. This mode returns a sgf file (the standard for storing go games) in which the different probabilities of each player and the variations suggested by KataGo are commented. With this I had everything to generate the graphs.
How to read SGF files
The next step was to find (or so I wished) a pyhton library that would allow me to work with sfg files. Luckily for me there was something ideal: https://mjw.woodcraft.me.uk/sgfmill/
SGFMill was more than I needed for the job, so by testing which nodes and which properties would lead me to the information I needed, I got a list with the evolution of the game (odds and score) and information about players, title etc.
|
|
The results (Divided by game)
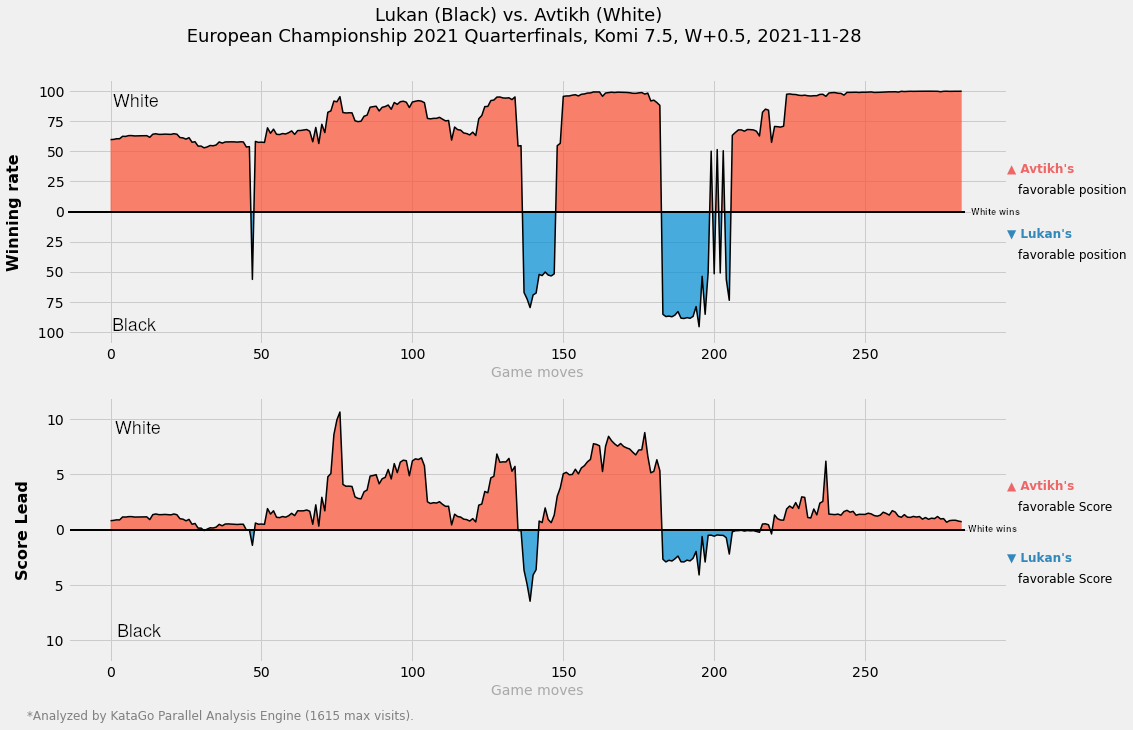
First I try with the Quarterfinals game:
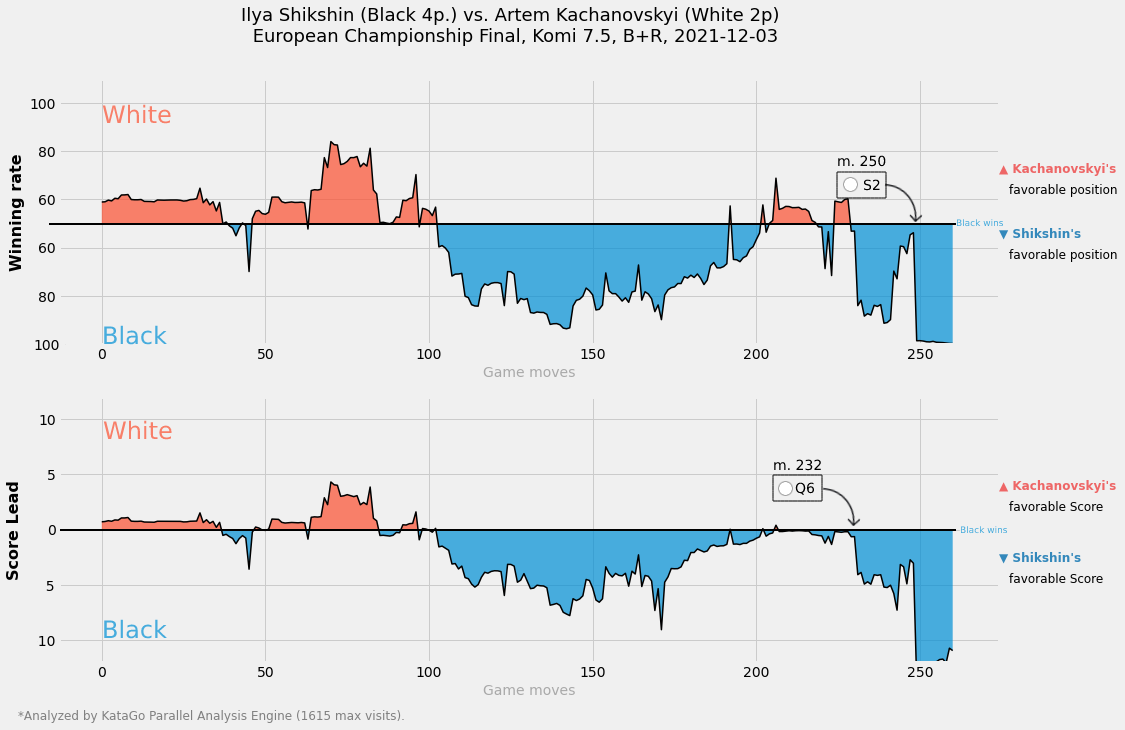
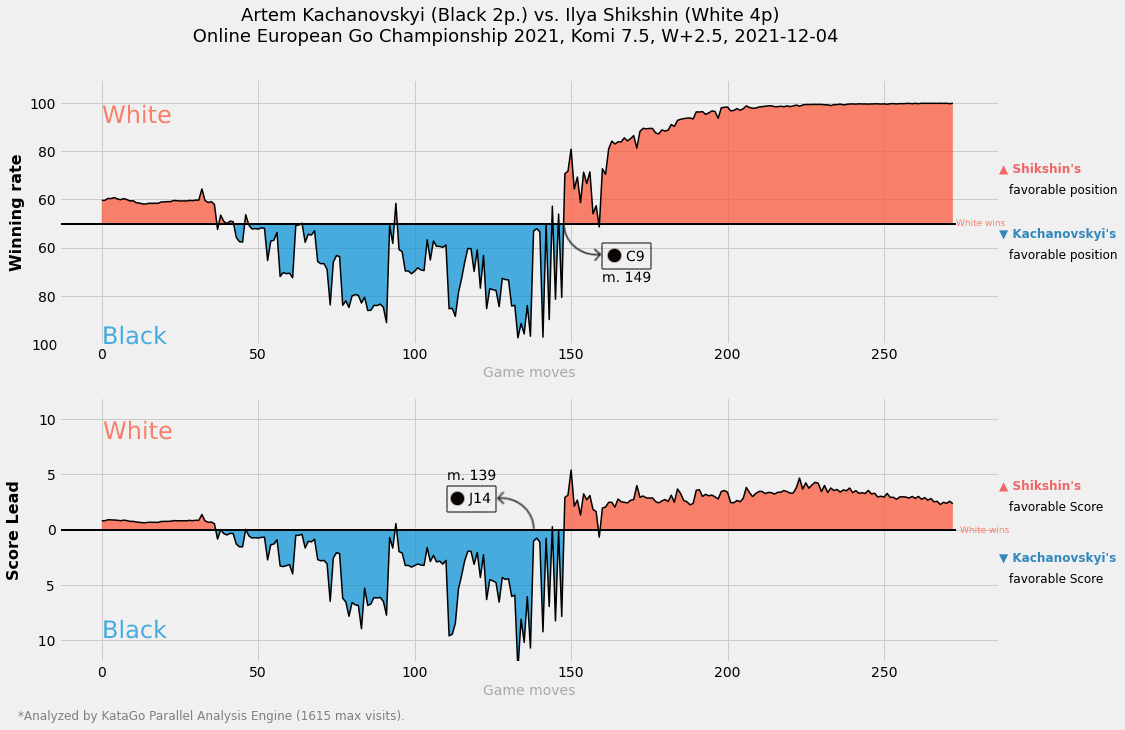
Meanwhile 1st and 2nd matches of the final were played:
The complete infography
And then, I mixed both of them and make a final full infography of the whole Final:
LINKS
I need to update this, sorry!