The global map of math (not really, but it is close)
Motivation
Lately I have been very obsessed with finding a way to create a concept map of modern mathematics. And it is not being easy. If we assumed that it was possible and that we had all the information, we would have a huge amount of information. The ramifications of mathematics are enormous and there are so many interconnected areas. It’s a daunting task and I don’t know if it’s impossible.
But whatever, the important thing is to have fun and learn along the way.
I started to look for some attempts in this line. But I didn’t like any of them. It is certain that there are really interesting schemes, but the structure towards impossible a visualization like the one that was looking for.
Finding MSC
I decided, considering the size of the project, that establishing all the connections would take time, but maybe a good place to start was to find a place where everything that needed to be related was. The goal was, therefore, to find an acceptable and used classification of the branches of mathematical knowledge that exist to date.
And immediately afterwards I thought of Arxiv. I started looking for how to classify the articles, what structure it had, and that’s when I got the first pleasant surprise: I found the MSC or the Mathematical Subject Classification.
Tons of data
(From wikipedia) The Mathematics Subject Classification (MSC) is an alphanumerical classification scheme collaboratively produced by staff of, and based on the coverage of, the two major mathematical reviewing databases, Mathematical Reviews and Zentralblatt MATH. The MSC is used by many mathematics journals, which ask authors of research papers and expository articles to list subject codes from the Mathematics Subject Classification in their papers.
It basically have three levels of structure:
-
At the top level, 64 mathematical disciplines are labeled with a unique two-digit number. In addition to the typical areas of mathematical research, there are top-level categories for “History and Biography”, “Mathematics Education”, and for the overlap with different sciences
-
The second-level codes are a single letter from the Latin alphabet. These represent specific areas covered by the first-level discipline.
-
Third-level codes are the most specific, usually corresponding to a specific kind of mathematical object or a well-known problem or research area.
TL;DR we have about 6000 thousand tags.
The truth is that I didn’t expect so many. As I said before, while this classification is interesting, it is not exactly what I was looking for. But it’s a start. In the world of research, the MSC offers a classification of the areas that have the most presence and body, from which I intuit that later I can obtain information about possible connections. But wtf I hav eso much data to plot LOL.
HOW?!
I was looking for a representation that was visually interesting, but also something from which I could draw some knowledge. Having so much data, it was not going to be easy.
Following the spirit of the MSC (areas of knowledge that have more specific areas) I thought that a representation as a phylogenetic tree or radial phylogenetic would be the most convenient.
I also think that a representation with graphs and connections could be very interesting, but, without the information of the extra connections between areas, it was going to remain a little bland.
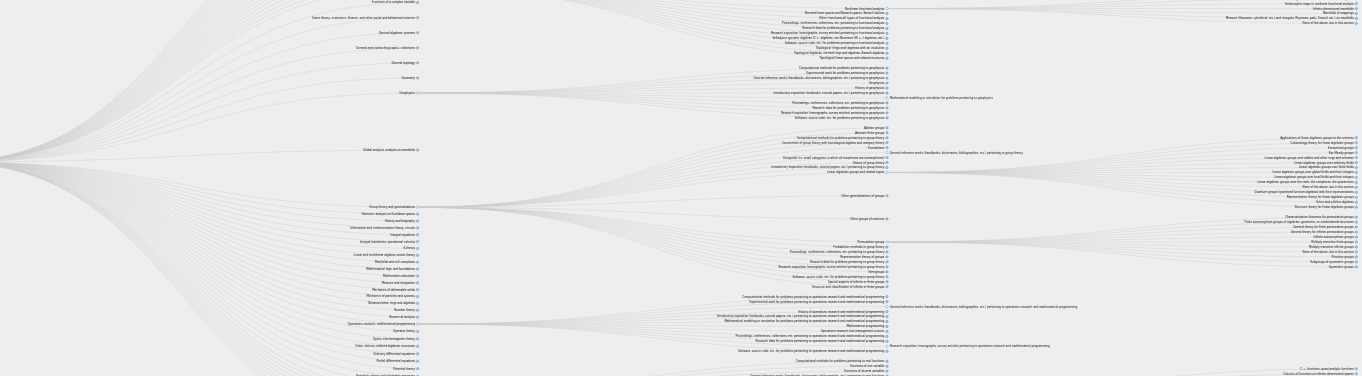
Even so, given the volume of data, generating something readable was going to be complicated. As I also wanted it to be available in my blog, I thought of something interactive with D3.js. And that’s where my first attempt came from:
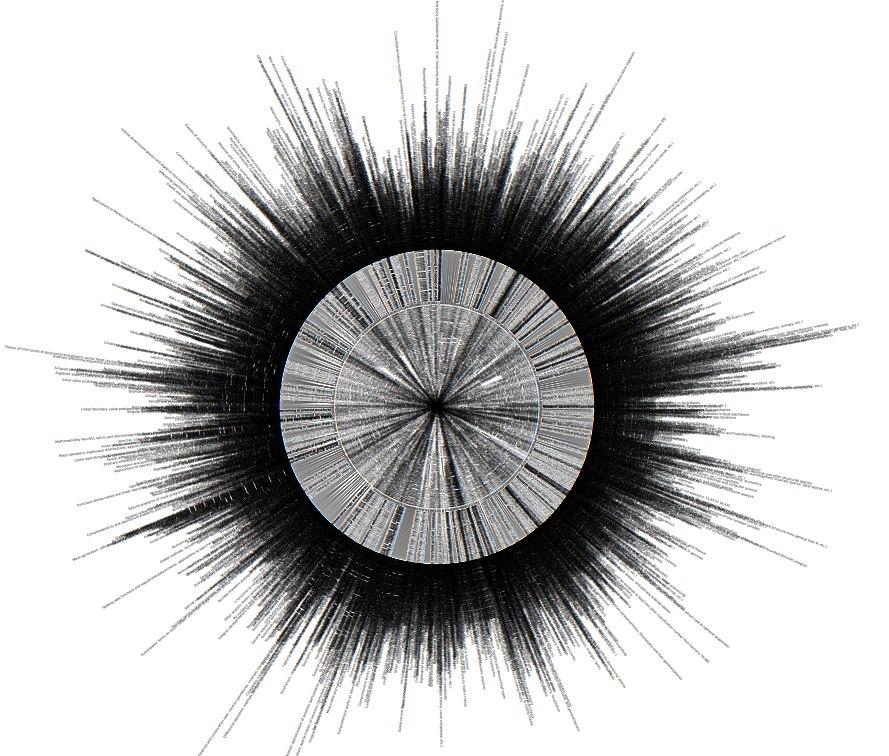
A interesting thought-provoking plot… sure, and completely unreadable.
At this stage it was clear to me that in order to obtain knowledge of my graphic I would need to have basic tools. That you could navigate through it, increase it, decrease it, decide what to look for and where.
So, D3.js had been a very good choice from the beginning, and I found a code that was just right for me. Wherever you are Robsmuecker, KUDOS my friend. This was just what I was looking for (given that I have little knowledge about D3.js).
I finally had an interesting and interactive presentation of math knowledge (more or less). And know, lovely reader, you have it too:
The final (only for now) map of mathematics
Here you have a quick screenshot of the plot:
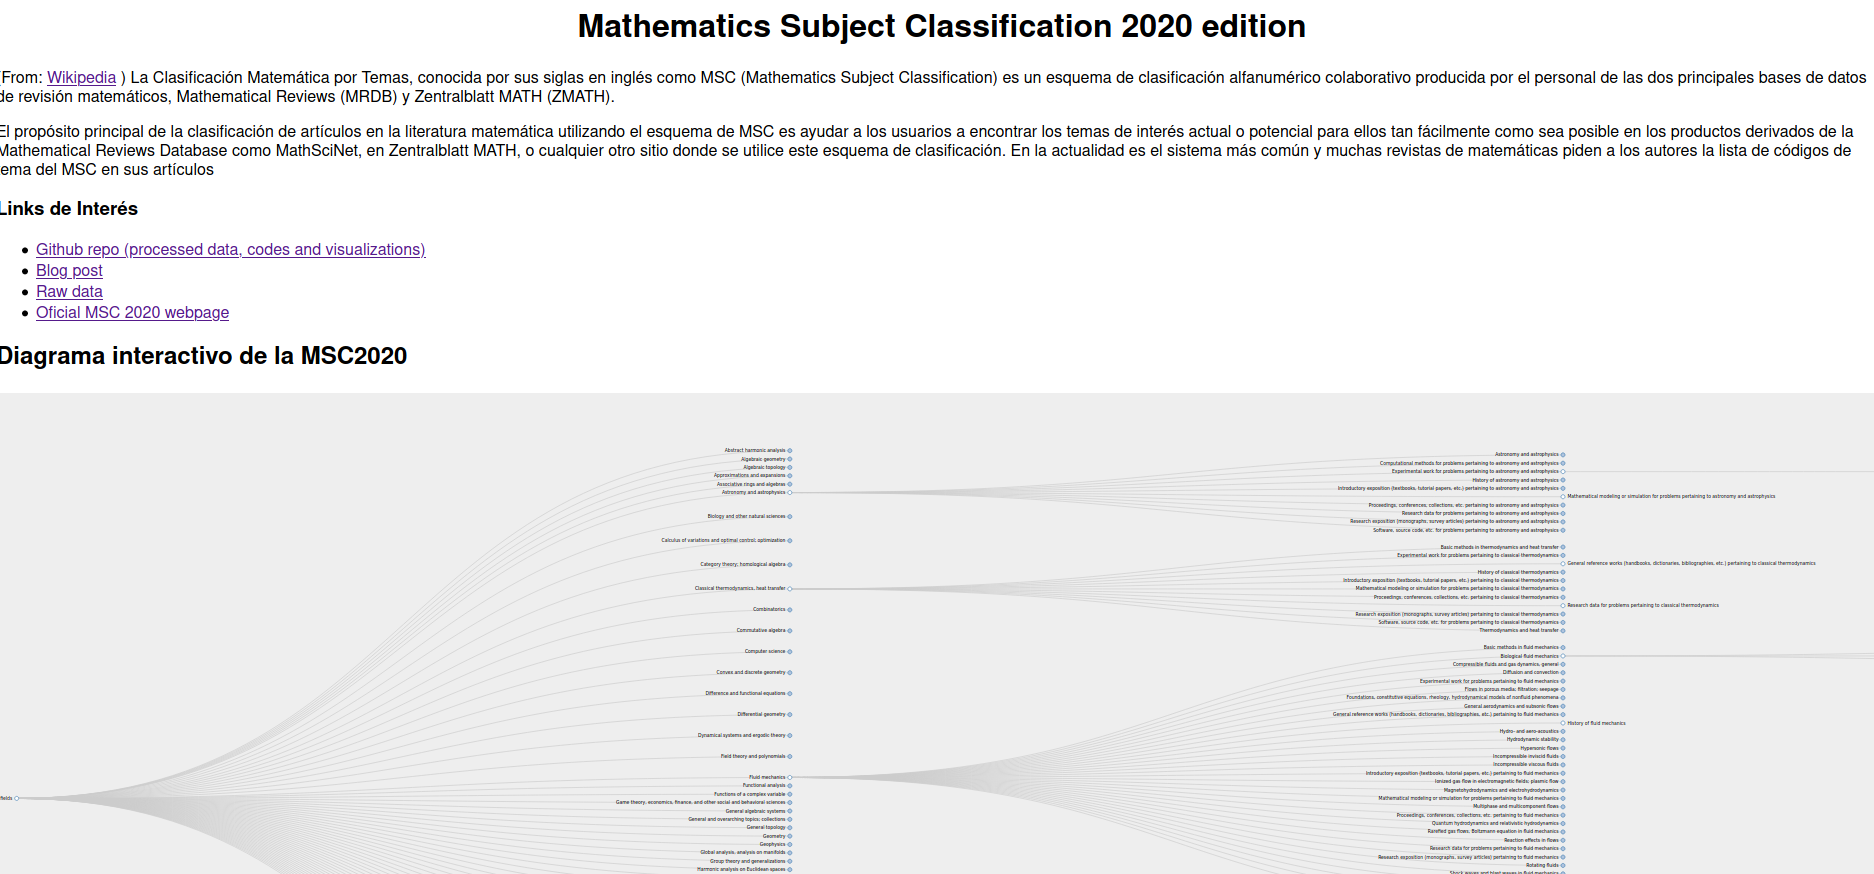
But, of course, I strongly encourage you to go and experiment and play with the plot by yourself.
You can find the final interactive map here (you can drag, click, zoom everywhere) Mathematics Subject Classification 2020 edition
Final thoughts
It was an interesting weekend project. I learnt a lot about math classification, and at the end I have a nice diagram in my blog that everybody can use.
However, it is not what I initially planned for. So I feel that it is kind of unfinished. I was thinking about get all the different maps I found in other post. And after that maybe came back and figure out the ULTIMATE DEFINITIVE SUPER math map. Yeah, that would be nice.