photo credits: Photo by Joe Woods on Unsplash
Plotting winning probabilities in a 19x19 Go / Baduk game
From this older post:
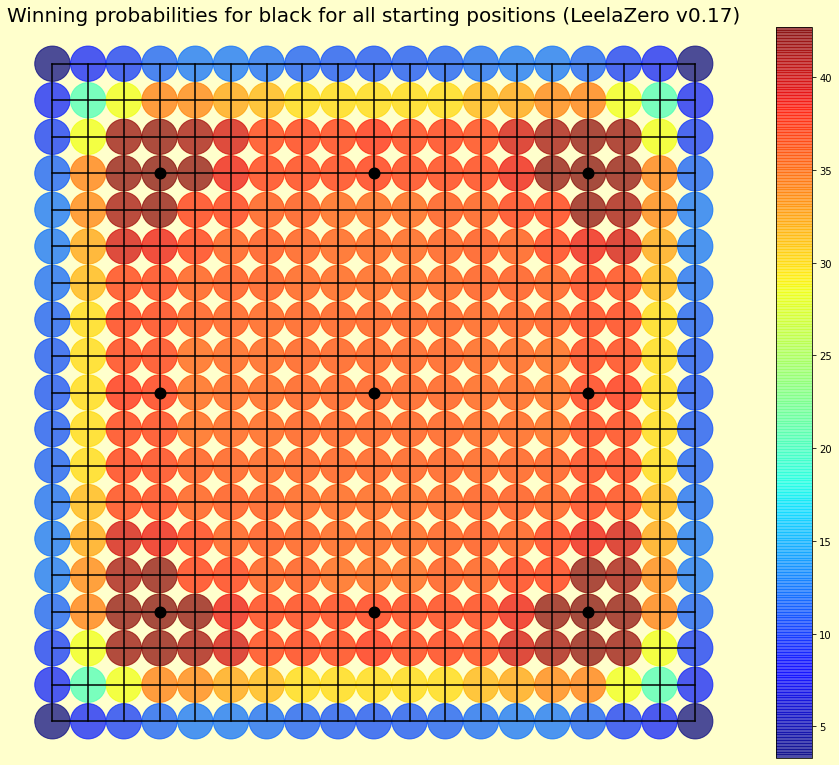
This morning I found this post on Reddit about winning probability for black for all starting positions.
I found this visualization quite interested but i couldn’t find any link to a source code to generate it or the data used to generate it, so I decided to replicate it myself.
Data
This time I run last version of Leela Zero v.0.17 with Chinese counting and 7.5 komi (using my GPU). I use the gtp engine via Lizzie an try every strating position.
I will upload the data via sfg, as Lizzie let you safe prob’s data. If I haven’t uploaded it yet and want to use the data, just send me a message.
Plotting considerations
Refer to this older post in order to know a little bit more about the code.
Results
Again, I am quite happy with the results. I think these heatmaps looks better than just adding squares to every point. It is just a matter of taste! However, I don’t LOVE the colormap. It’s close to the initial style, but the percentage variations are too extreme and I haven’t found a colormap that, in my opinion, reflects well the data (aesthetically). I know I could design one by hand to be better, but, for now, I think jet does its job.

